Coming from an SEO background, and developing sales funnels for my own companies and clients for the past three years, I’ve become familiar with pretty much every metric out there. Google rankings, positions of keywords, time spent per view, cost per click, bounce rate, email open rates, you name it.
After much testing, tweaking, and investing a small fortune, I’ve come to the realization that many of these are just vanity metrics. In other words, they’re distractions that won’t actually allow you to grow your online business.
Now don’t get me wrong, most of these metrics are important in their own way, usually at a later stage of your online business, when you’re making money and want to fine-tune and increase your performance.
However, as entrepreneurs, we need to learn to focus on what’s important and either outsource or block out the rest. That’s especially important for early stage entrepreneurs, who have limited time and money at their disposal. We just don’t have time for metrics that distract us from what we need to do—grow and increase revenue.
In my experience, truly successful entrepreneurs and digital marketers focus on the two metrics I’m going to share with you today.
Ignore them, and it could actually doom your business. Know them, and you’ll make progress. Not only that, you’ll have the peace of mind in waking up each morning knowing what you need to focus on. So let’s get going.
Decluttering Your Mind From Unimportant Data
Here’s just one example of how focusing on the wrong metrics will get you nowhere. I once had a client that was highly ranked on Google and was getting north of 2,500 visitors a day from his organic reach. You’d think this guy was killing it, right?
Well, not exactly. He was getting zero sales on his website, because he was ranking for ALL of the wrong keywords!

So we decided to change the approach and optimized his website for a whole new set of lower searches queries.
Guess what: Traffic went down. Rankings went down. But sales went UP! Contrary to popular belief that traffic equals money, rankings and visitors will not bring you any revenue unless it’s relevant to your business.
In fact, most of the time you don’t actually need more traffic. As Ryan Deiss would say, there’s never a traffic problem. Most likely your website or landing page has a conversion problem. The trick is to make more sales and turn more visitors into customers with your current traffic.
And that happens when you focus on the two most important metrics out there.
The Two Most Important Metrics for your Online Business: CPA and AOV
For your online business to grow, you need to know exactly what your CPA and AOV are, and how they relate together. Let’s break them down and see how they work.
CPA: Cost Per Acquisition
In short, this metric tells you how much you’re paying to acquire a new customer.
This is easiest to pinpoint when you’re doing paid advertising, and can get a bit tricky when you’re relying on search engine or social media traffic. But don’t worry, I’ll show you how you can track all of this in a minute.
So how do you calculate CPA? By checking out your past performance and going from there. If you’re starting out, you’ll have to use a somewhat arbitrary value that you will set up, but if you have some hard data to back it up, way better.
So for example, on one of my consulting clients, we spent around $4,121.85 in Facebook Advertising and generated around 133 new clients. That’s a CPA of $30.99. Or, in other words, we paid around $30.99 for every new customer we acquired.

You’ll need to factor in some other costs like labor, hosting, tools, fees from your marketing agency, etc. But for the sake of simplicity I’ll just keep it to actual advertising costs.
AOV: Average Order Value
But CPA is only half of the equation. The other half comes from AOV, or Average Order Value. In short, this is how much money customers are spending on your website, online store, or service, every time they purchase something. Usually we will focus on the first time they get an order, since everything after that would be considered LTV or Lifetime Value, but that’s a metric for another post.
Let’s say that you sell one $500 product. Your AOV is $500. Granted, that’s probably not the case, because ideally you’ll have several products, discounts, deals, upsells, downsells, coupons, etc. If so, this number should be an average that you can calculate by taking your last month or 60 days, adding up all of your revenue, and dividing it by the number of orders you had over that same period.
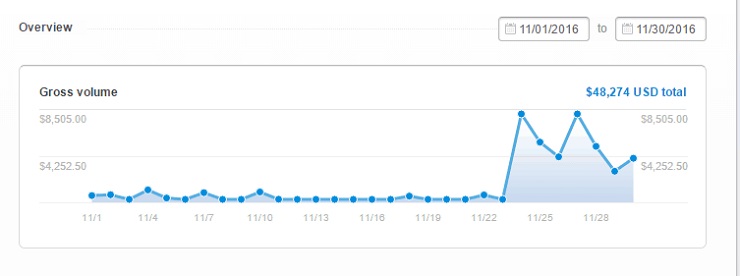
On the same example, last month we had 133 orders and made a total of $48,274 in revenue. This means that the AOV for this particular client is around $362.96.
Why Are These Two Metrics Important?
OK, now that you have these in mind, you might be asking, “Aren’t these just another two metrics?” They are much more than that! In fact, your business revenue will come from the difference between your CPA and your AOV.
Back to the example, we spent $30.99 to generate a customer and that customer brought $362.96 back. That’s a difference of $331.97 for every customer we generate. Should we decide to invest $10,000 in our next Facebook ads campaign, we would be generating 322 new customers and $106,894.34 in revenue back. That’s a 970% ROI in just one month.
In fact, that’s exactly what happened to this client! How would you feel if you could invest $1 and get $100 back? That’s the power of knowing these two metrics and being 100% positive that you’re being profitable. The wider the gap between your CPA and your AOV, the more money your company is making. It’s simple math that anyone can do (keyword: simple).
Of course these results are typical, but not guaranteed. I’m not saying you’ll generate $100 for every $1 you invest in advertising, but what you can do is to start generating $1.50 and you’ll be profitable. And then you can scale up.

Starting From Scratch And Building From There
But what if you’re just starting out and have no idea what those numbers are? When people ask me how they can project or calculate their CPA and AOV if they don’t have the metrics in place yet, the answer is also pretty simple. You can use these two metrics as guideposts for future planning.
I usually aim for a 2-to-1 return on investment for paid advertising. Usually the return is much, much higher, as you saw before. But I tend to be conservative when projecting and drawing up a sales funnel from scratch.
If your average order value (AOV) is $500, then to get a 2-to-1 ratio you’ll need to be paying, at most, $250 per customer acquired (CPV). It doesn’t really matter how you acquire this customer. Whether it’s via SEO, paid advertising, webinars (my personal favorite), etc., the main point here is that you pay no more than $250 per customer.
How to Track These Two Metrics And Know If You Can Scale?
Ok so now that you have true clarity of what you need to pay attention to, let’s address the best ways to track them.
One quick side note, there’s no tool out there that is 100% accurate. They all have their advantages and disadvantages. So don’t sweat a couple of points of difference, or a sale reporting as $500 in one tool and $495 in the other. Most of the time you’ll end up crossing information between platforms as I’m going to show you in a minute. Main thing is to keep it simple. You don’t want to get bogged down in the details.
Here are some tracking methods that I find really reliable:
Google Analytics Goals: The way to setup Google Analytics goals is pretty simple. Once you have your Google Analytics code installed in every page of your website, you’ll need to tell Google Analytics what to consider as a goal. Here’s an article showing you how to do it.
For example, let’s say you have a “thank you” page for your $500 product, which is called www.yourdomain.com/thank-you-for-your-purchase. You’ll need to setup a goal with a value on Google Analytics like this:
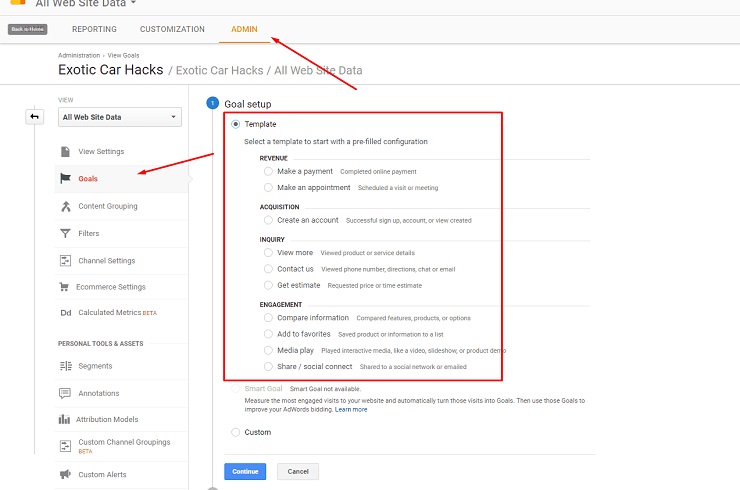
It’s important that you setup Google Analytics to track only one conversion per visitor. That way, if the visitor lands on the page again it won’t skew your results.
If you’re also doing a Google Adwords or YouTube advertising campaign, you might want to install the Google Conversion Code on the Thank You page for your purchase. That will tell Google that you made a sale every time someone visits that page. And you can see if your campaign is being profitable “at a glance.”
Note: if you’re not a technical person or you just don’t want to do it, I suggest you go to Upwork or Freelancer.com and hire somebody do this for you.
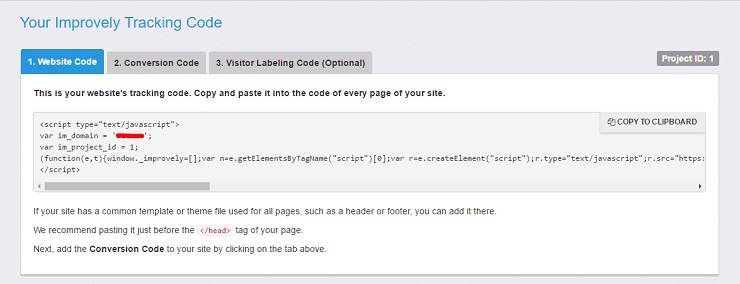
Improvely: This is my personal favorite that I use for everything. In my opinion, it is much easier to set up than Google Analytics and it’s more reliable. Improvely will give you a code to add on every page of your website and then a conversion code that you can modify depending on the goal.
Improvely will allow you to track leads, calls, conversions for different products, etc. What we’re trying track here are the sales that your website is making so we can use that information later. So you will set up an Improvely code like this:
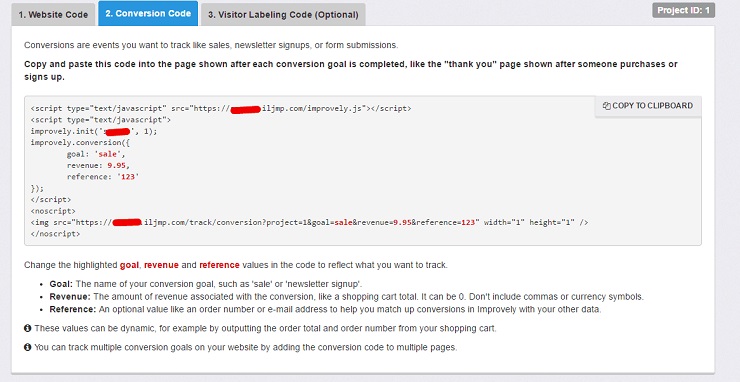
Put it on the header of your Thank You page, like we did with Google Adwords Conversion Code. This will give you more information about your website, like how many people visited and how many people turned into customers, etc. These will likely come in handy as you get more advanced in your analysis further down the line.
Facebook Conversion Pixels: Facebook pixel has come a long way over the past year or two. At the time of writing this post, you’ll use the exact same pixel to track conversions, provided that you’re advertising with Facebook (which I strongly recommend you do).
The process is similar to Google Analytics and Improvely. You have a “PageView” code you need to install in every page of your website and then a “Purchase” code with a value in it. You will put this code in the header of your Thank You page for your product. Here’s a Facebook Pixel Tutorial for you to review.
There are some other more advanced things you can do with Facebook pixel too. But bottom line, at the end of each month, you’ll need to gather your numbers and put them on the table:
- How much did we pay on advertising?
- How many new clients did we generate?
- How much are we paying per customer?
- What was our total revenue?
- How many orders did we have?
- What is our Average Order Value?
- What is the difference between how much you’re paying and how much we’re generating per customer?

Steps to “Widen The Gap”
Once you have this information in place, your main focus will be to widen the gap between your CPA and your AOV. Remember that the less you pay to acquire a customer and the more this customer spends with you, the more money your company makes. Simple, right?
I know I said these two are the most important metrics, and they are. But once you’ve got a solid grasp on CPA and AOV, it’s time to break them down into the numbers that make them go up and down. Yes, even those vanity metrics.
But at the end of the day, your focus is simply to lower your CPA and increase your AOV. Let’s see how to make this happen:
How to Lower Your CPA
When you’re trying to lower your Cost Per Acquisition, you’ll need to pay attention to metrics like Conversion Rate and Cost Per Click. Let me give you a quick example:
Let’s say that your sales page converts at 2% (meaning that every 100 visitors, you’ll get 2 sales), and you’re paying $0.50 per click to drive traffic to that page. If you want to send 100 visitors, you’ll need to pay $50.
$50 spent at $0.50 per click → 100 clicks at 2% conversion → 2 sales
$25 CPA
However, when you lower your CPC to say $0.40, you can send 100 visitors for $40. That means that you will be paying less money for the same amount of people visiting your site. Now if your sales page converts at 3% instead of 2%, you will get 3 sales from every 100 visitors.
$40 spent at $0.40 per click → 100 clicks at 3% conversion → 3 sales
$13 CPA
Woohoo!
So in one scenario you’re paying $50 to get 2 sales ($25 CPA) and in the other scenario you’re paying $40 to get 3 sales ($13 CPA). That’s almost half the cost to acquire a customers with some simple tweaks to your funnel! In fact, tweaking your landing pages so that they convert 2%-5% better could mean several thousands of dollars of revenue at the end of the month.
How to Increase your AOV
When you’re trying to increase your Average Order Value (AOV), there are a couple of things you can do almost immediately. The first is the simplest and more overlooked of them all, which is simply raising your prices.
Raising your prices from $500 to $600 or $750 will increase your AOV, because people are just spending more money with your company every time they purchase your service or product.
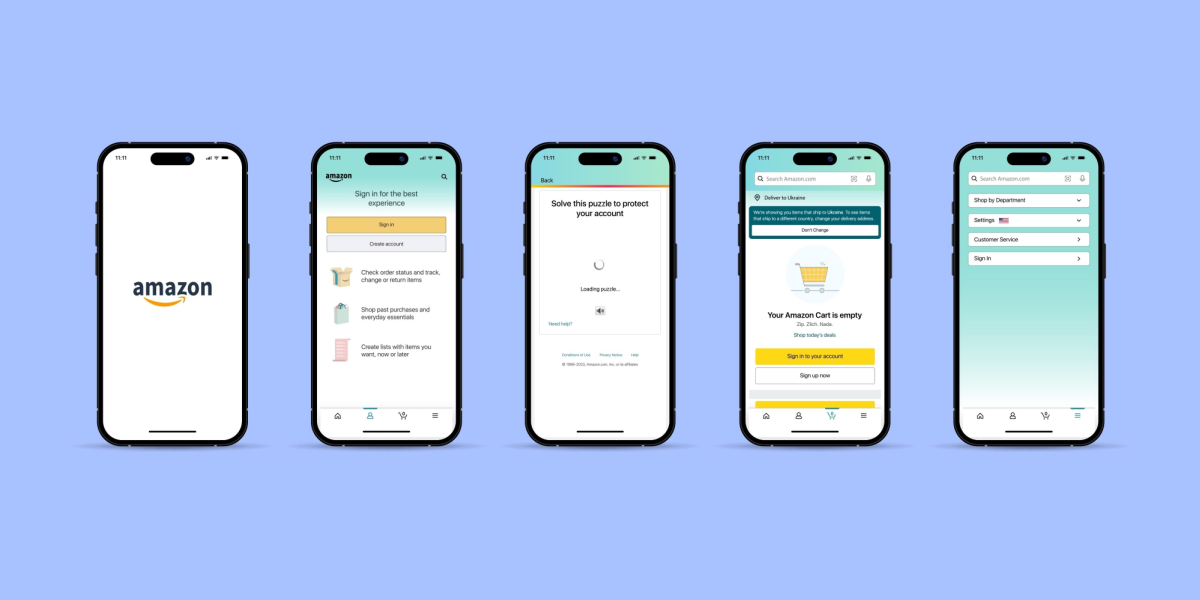
The other great way to add more value to your average order is by selling more products or services in the same offer. See Amazon for a great example. On their checkout page, they’ll always show you what products match yours, and very often people will say yes! In fact, you can generate 30% more revenue just by implementing an upsell on your funnel (as I mention on this video).
This is a great strategy, because your best customers are your current customers—people who have given you money in the past. It’s so much easier to sell additional things to your current customers than it is to create a customer from cold traffic. So the third step would be to create recurring sales and upsells, with higher pricing and higher value.
—
So here you have it! These are the two most important metrics for your business, how to find them, track them and widen the gap. Once you have these two metrics dialed down, nothing prevents you from growing and scaling your business to the moon!
I hope it makes sense for your business and you can increase your ROI like you never thought possible. Got any questions on this? Ask away in the comments!
Have an amazing day!