If a picture’s worth a thousand words, how much is an infographic worth? How about a 400% increase in revenue, like Venngage achieved by creating infographics for influencers? Or backlinks from CNN and TechCrunch, like WordStream got thanks to two infographics?
When we think of growth hacks to drive traffic to our site, we often think of SEO, advertising, or social media marketing; we don’t often think of the visuals. But infographics—images designed to convey information about something—have the potential to skyrocket your traffic if you know how to do it right.
Below, I’ll show you why infographics matter, how to create a compelling infographic, how to make it go viral, and how other businesses have leveraged the power of infographics marketing.
Why Use Infographics in Marketing?
With all the items on your to-do list as an entrepreneur, you might be loath to add one more. But infographics are powerful marketing tools, and they don’t have to take up all your time. Here’s why you should incorporate infographics marketing into your business:
Don’t Skip: Word of Mouth Marketing – The Untapped Strategy That Never Fails
People Love Visuals
The most obvious reason? People love looking at images and can use them as a shortcut to reading.
Eye-tracking studies by Nielsen Norman Group found that when images contain relevant information, readers may spend more time looking at them than “fluff” images such as stock photos. Infographics are an easy-to-digest way of conveying information to a busy reader.
Infographics Are Extremely Shareable
Unlike clunky text that’s visually unappealing and doesn’t exactly scream “share me,” infographics are designed to be shared across social media platforms and websites.
Adding embed codes and share buttons increases the chance of your infographic getting shared. Simply include an embed code with your infographic to allow others to easily include it in their blog posts.
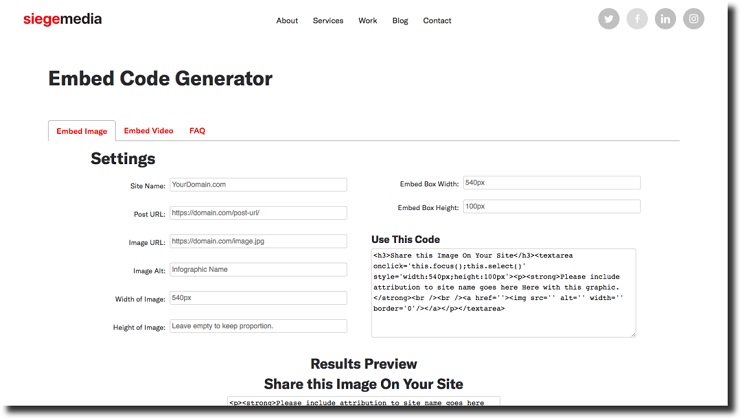
Whoa, code? Don’t worry! You don’t need to be a developer to figure this one out. Here’s the easy way to create an embed code for your infographic: Use Siege Media’s Embed Code Generator.
Infographics Help Build Backlinks
Savvy website owners know that a high Domain Authority (DA) is crucial to ranking well in search results. And how do you boost domain authority? By building backlinks.
Backlinks are links from other websites to your website. These links tell Google, “Hey, this website is legit and has valuable information!” Infographics can secure backlinks from other blogs by providing images to go with posts on a certain topic.
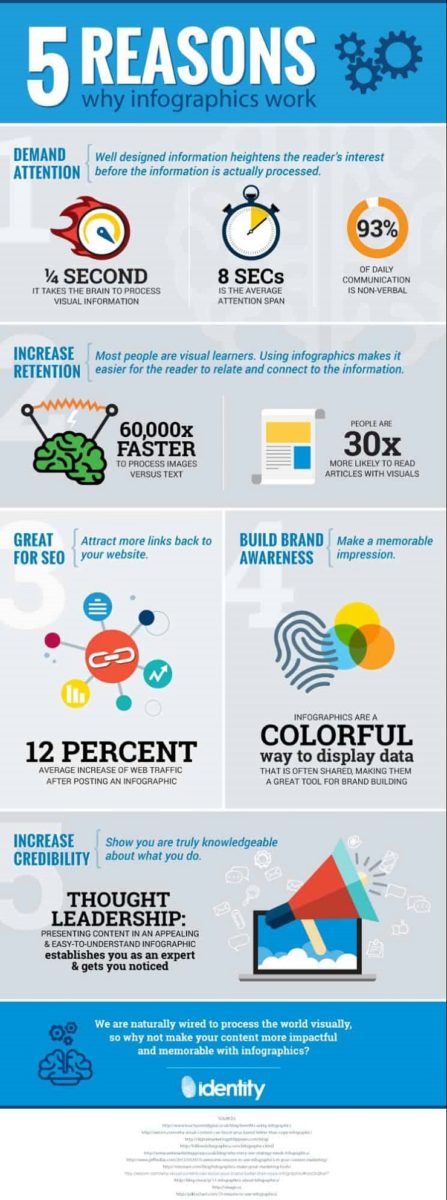
What might that look like? Let’s say a freelance writer needs an infographic for an article about why you should use infographics in marketing. So they use your infographic (like the one below) and credit you with a link back to your site.
See what I did there? Gathering data about a specific topic and turning it into an infographic helps content creators have visuals to support their work and helps you build backlinks. It’s a win-win!
Infographics Build Brand Awareness
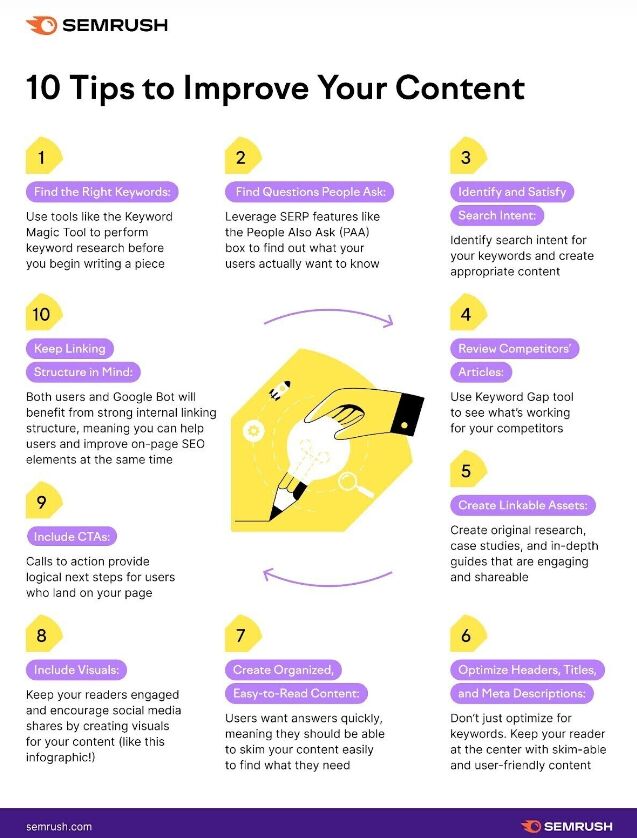
Part of building brand awareness is the repeated use of your colors, logo, and brand aesthetic—all of which can be incorporated into your infographic. Notice how SEMRush tastefully brands its infographic with its colors and logo:
Infographics Can Enhance Your SEO
While most SEO advice focuses on Google search results, there’s an aspect that’s often neglected: Google image search. By including keywords in your image file name and alt tag, you can boost your infographic’s rankings in Google image search and drive traffic to your site.
How to Create an Infographic That Demands Attention
Pick a Compelling and Relevant Topic
If you want your infographic to go viral, you need to pick a share-worthy topic. Make it something compelling, and if it’s tied to a trend, even better.
How do you know what’s trending? Some places to watch:
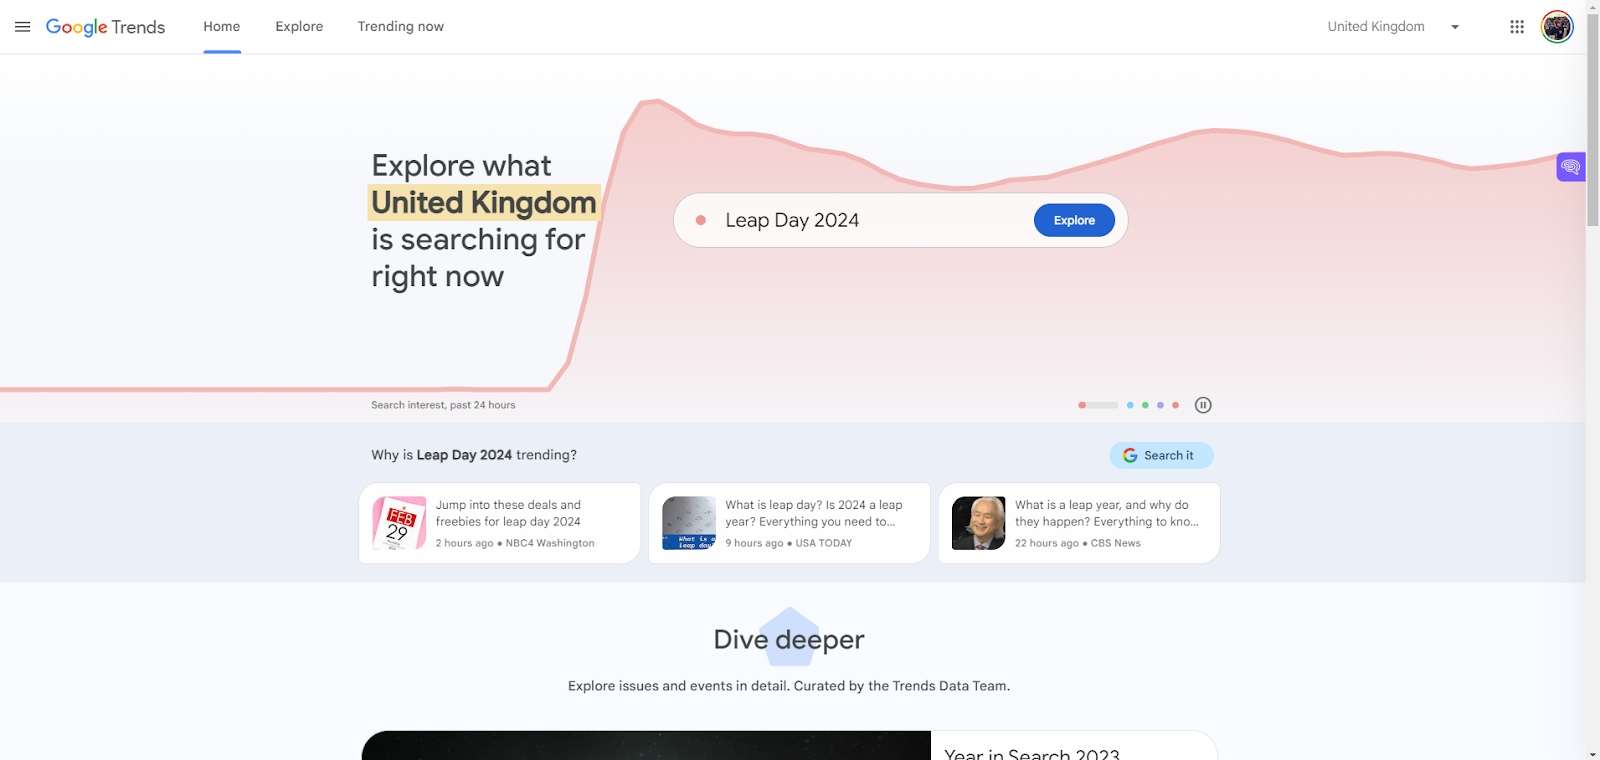
Google Trends – This page clues you into what the world is searching for on Google lately.
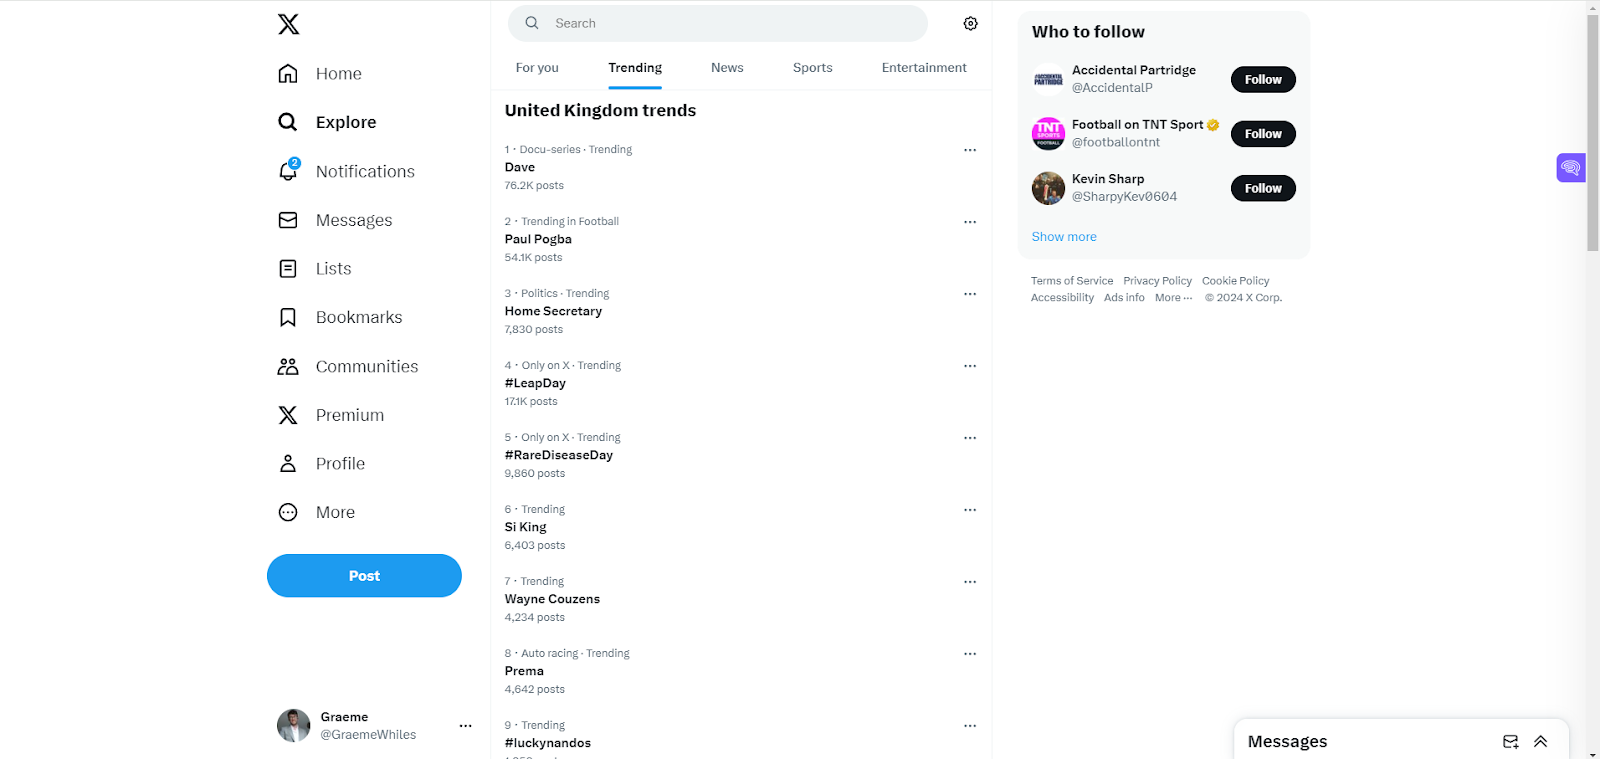
X – Look at the trending hashtags on the left side of your X page to see what everyone’s talking about at the moment.
BuzzSumo – Go to Content Research > Trending Now. You can even select a specific topic to see the trending news articles in that category.
Another effective strategy is using keyword research to help you determine if people are interested in a particular topic. This will save you from wasting time on a dud. I use premium tool Keysearch to find the search volume and competition of keywords.
Finally, make sure that your topic is relevant to your business. This is marketing after all, so there’s no use in having an infographic go viral if it’s not going to attract potential customers to your business. How will you know if your topic is relevant? It all begins with knowing your target audience.
Conduct Research
Infographics require information, so it’s time to find high-quality statistics and other info to use as the basis for yours. Here are some resources for finding data to use in your infographic:
- Hubspot is a great resource for roundups of marketing statistics.
- Statista is a portal for more than 1 million statistics and facts.
- U.S. Data and Statistics contains economic, population, and demographic data.
- Google Scholar is a searchable database of scholarly literature such as research papers.
- Google Public Data compiles data from international organizations and academic institutions.
- Gemni AI certainly isn’t a tool we would recommend for specific statistics, but it is a great option for brainstorming ideas, asking for suggestions, and understanding statistics in much greater detail.
CopyPress put together a helpful list of places to find statistics for infographics. Curate content from reliable sources, and make sure to cite sources in the footer of the infographic.
Design With Your Ideal Customer in Mind
Don’t let a lack of design skills hold you back from creating a viral infographic. While you could use premium programs such as Adobe InDesign or Photoshop, there’s no need when you can design it for free.
Here are some free tools for designing infographics:
When designing your infographic, keep your focus on your ideal customer. Remember to incorporate your brand identity to create a memorable infographic.
How to Distribute Your Infographic for Maximum Traffic
Okay, you’ve done your research and you’ve created a stunning infographic. Now we get to the final and crucial step: promoting your infographic for maximum traffic. After all that hard work, the end product might not get anywhere if you fail to promote it.
If you want your infographic to drive loads of traffic to your site, leverage some of these promotion strategies:
Infographic Directories
There are websites where you can submit your infographic. This results in a backlink to your site and gets more eyeballs on your work.
For more ideas, check out this post on where to submit infographics.
Instagram has been at the heart of content strategy for many years now, and that doesn’t look like slowing down any time soon.
Therefore, one great outlet for your new and fresh infographic is your brand’s Instagram channel.
It’s important to factor in the shape of your infographic here, though, as a long portrait style will not fit the standard Instagram grid, but don’t let that deter you.
You can either alter the infographic to fit the space, turn it into a carousel post, or even add some minimalistic movement elements and a backing track and turn it into a reel.
This could play to your advantage, as recent data suggests that Reels get an average reach rate of 14%, compared to the standard 9% for other types of posts.
Not to mention the fact you can quickly and easily post that very same content to TikTok for even more exposure.
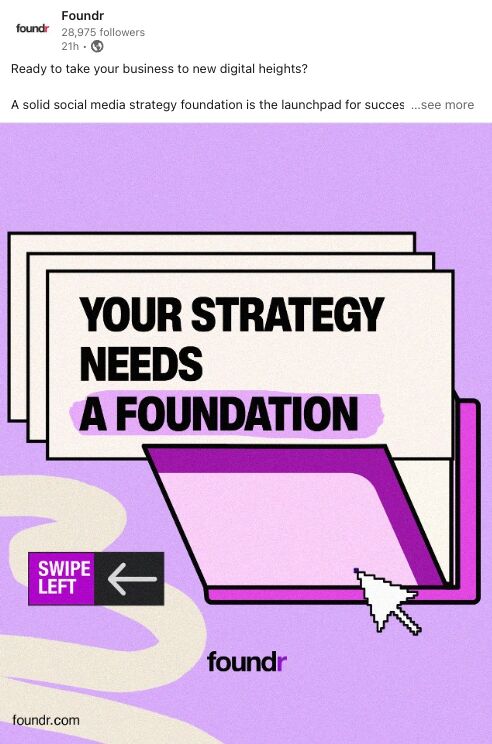
It’s fair to say that LinkedIn is having somewhat of a moment right now when it comes to marketing and brand exposure.
In fact, according to Hootsuite, LinkedIn has had exponential growth in newsletter subscriptions since early 2023, reaching 450 million globally by the start of 2024. This is an increase of 3x year-over-year, showing the platform’s popularity and influence on professional communication channels.
This makes it a brilliant channel for you to add your infographics, whether it be as a standalone post or part of a newsletter offering.
Within Blog Content
Another fantastic place to include your professional infographics is within your blog content.
Google undertook a major algorithm update back in November 2023, which has placed even more emphasis on the importance of unique content that provides a fresh perspective on a given subject, and by adding your own infographics into your content, you do just that in a way that will also resonate with your audience.
This social media platform has two great things going for it:
- It’s inherently visual.
- The images are clickable.
See where I’m going with this?
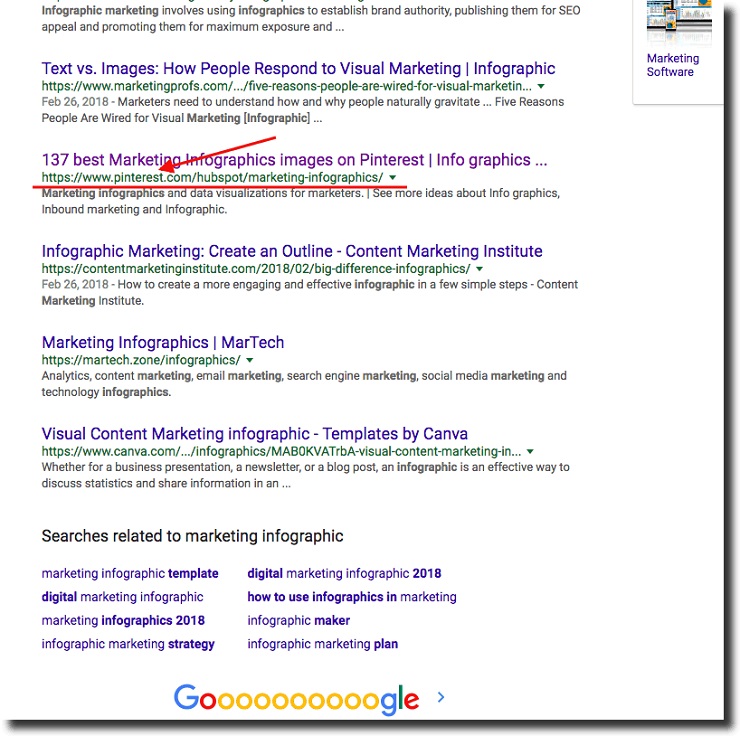
Infographics do particularly well on Pinterest. On top of that, they do well outside of Pinterest. Many times, when I’m doing a search for a keyword, infographics from Pinterest show up at the top of Google search results. In a highly competitive market, this can be an excellent way to help your product stand out from the crowd and differentiate yourself from your competitors.
Much like submitting your infographic to a directory, adding it to Pinterest houses it on an authoritative site, making it that much more likely to be indexed by Google and found by searchers.
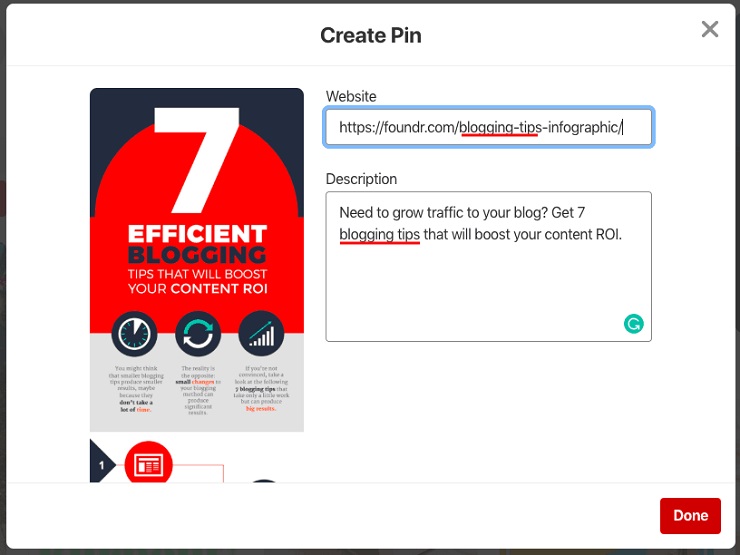
To give your infographic a Pinterest SEO boost:
- Name your image file with your keywords.
- Write a keyword-rich description.
- Link back to your webpage with the infographic on it.
- Pin it to relevant boards.
- Create a board with keywords and pin your infographic to it.
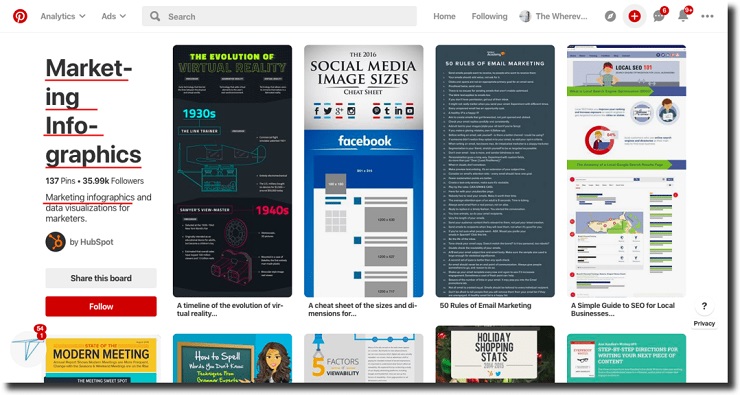
Here’s an example of how that might pay off. When I type in “marketing infographic” in Google Search, look what shows up on the first page:
A Pinterest URL! When I click that search result, look where it leads:
That’s a Pinterest board created by HubSpot, and they’ve added the keyword “marketing infographics” to both the title of the board and its description.
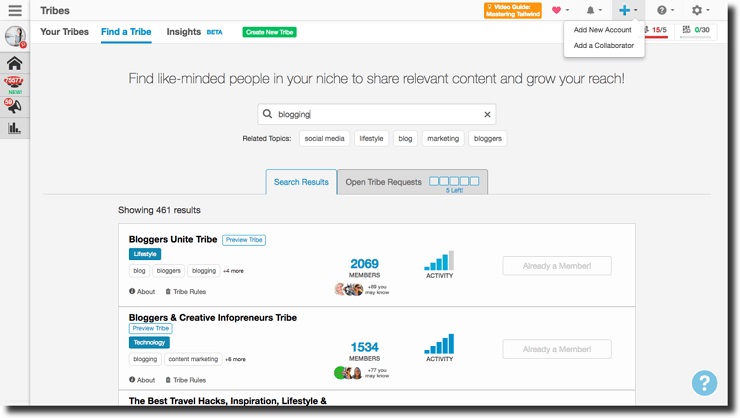
Next, add it to Tailwind Tribes. Tailwind Tribes is a free feature that lets you amplify your pins by sharing them to Tribes where like-minded pinners are looking for content like yours to pin to their own boards.
- To begin, type in a keyword to find relevant Tribes you could join.
- Next, check their rules. Often, Tribes have strict rules about sharing, like you should repin one from someone else for every pin of your own that you share.
- Request to join. If required, request to join the Tribe and wait for approval.
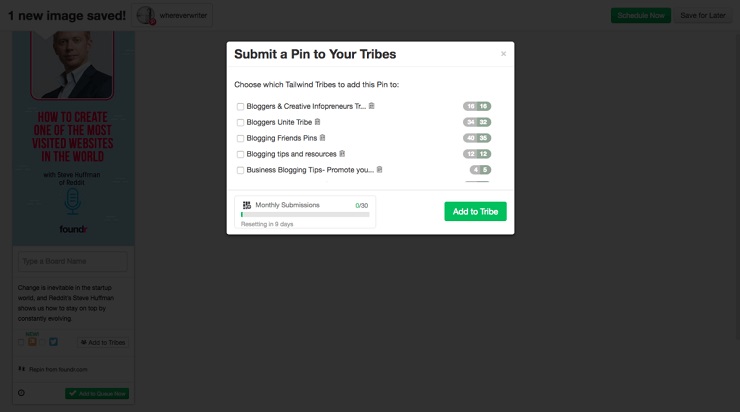
- Pin your infographic to the Tribe. Recall what we talked about above and be sure to add keywords to the description when you add it to the Tribe.
Press Releases
Journalists are hungry for interesting stories, and if you did your research right, your infographic tells a compelling story. If you use a press release distribution service such as PRWeb or PR Newswire, your press release (and infographic) will get submitted to numerous journalists and bloggers, resulting in backlinks, and it might even get picked up by a major publication.
Email Outreach
Now that your infographic is a visual representation of carefully curated sources, why not email those sources and let them know they’re featured in it? They might share it with their network, expanding your infographic’s reach.
Infographic Etiquette 101
Cite Your Sources
Often, especially with marketing statistics, you’ll find lots of secondary (and even tertiary) sources. For example, Company A will do a roundup post citing statistics from a study conducted by Company B. In that case, Company B is the primary source, so you should find their original study and link to it. Same goes for a blog post that references another blog post, study, interview, etc. Always give credit to the original source of the info, not second party referencing it.
Now, citing sources in an infographic—a medium that in its very nature should be visually appealing—can become clunky. A quick fix for this is to simply cite sources in the footer of the infographic. Here’s an example of one that I think is tastefully done:
Fact Check Statistics
If you can’t track down the source of a statistic—don’t use the statistic. And just because a blogger says a survey showed a certain finding doesn’t make it true. Track down the original survey and make sure the numbers are correct.
Don’t Spread Misinformation
This ties directly to the previous point on fact checking, but it’s so important it bears repeating: Don’t spread misinformation in your infographics. Not only is this unethical, but if you do it, it could undermine any credibility you were hoping to build for your brand.
My favorite—as in, most despised—fake statistic that you’ve probably seen in countless infographics is that the human brain can “process visuals 60,000 times faster than text.” That “fact,” it turns out, is completely unfounded. So don’t let me catch you using that in your infographic!
Credit the Infographic Creator
If you plan on using infographics made by others in your own content, be sure to credit the infographic creator. While there’s no set rule, it’s typical to include their name and a link back to their site.
Infographic Growth-Hacking Case Studies
So we’ve gone over why infographics marketing matters, how to create a stunning infographic, how to make it go viral, and infographic etiquette. Now let’s round it all off with some solid case studies so you can dissect their strategies and apply those lessons to your own marketing.
How Venngage Boosted Revenue By 400% by Creating Infographics for Other People
Infographic software company Venngage used a really interesting infographic strategy to grow their revenue: They offered to design and promote infographics for other companies.
As Nadya Khoja explains, they needed to make an offer an influencer couldn’t refuse. And as an infographic software company, Venngage was in the unique position to create infographics for these influencers.
So Khoja started by researching influencers to contact and organized them into spreadsheets. Using BuzzSumo, she identified each influencer’s most popular content. This is the content she would offer to turn into an infographic.
Next, she pitched those influencers with an offer to create an infographic based on their popular post. She did not ask for anything from them in that initial outreach.
After creating the infographic, not only did she share it with the original influencer, but she also promoted it to other influencers. According to Khoja, this infographic marketing strategy resulted in a nearly 400% increase in Venngage’s traffic, registrations, and revenue.
How WordStream Got Backlinks From CNN, Huffington Post, and More Thanks to 2 Infographics
Internet marketing software company WordStream got strategic in its approach to infographics marketing—and it paid off with high-authority links from CNN, TechCrunch, and The Huffington Post.
First, they began with proper topic selection. If you want your infographic to go viral, WordStream recommends choosing a topic that is compelling, even provocative. You want your angle to have some element of surprise. Which topics did WordStream go with? “Internet Privacy: Google Privacy and Your Privacy on Facebook” and “Google Flops and Failures: The Failed Google Graveyard.”
Next, they conducted outreach to highly relevant and influential websites; they found them by scouring Google. They also did social media outreach, which helped their infographics get to the front page of Digg, Reddit, and StumbleUpon.
All of their efforts resulted in high-quality backlinks from news sites that otherwise probably wouldn’t have linked to WordStream’s site.
Keep Learning: How to Start a Podcast a Step-by-Step Guide
Ready to Add Infographics to Your Marketing Strategy?
As you can see, an infographic is more than just a pretty image. When properly researched and stylishly designed, they can be powerful growth-hacking tools that will boost backlinks and traffic to your site.
If you’re struggling with where to start, begin with what you have! Find a popular article on your website and turn that content into an infographic.
Remember to add an element of surprise that will give your infographic a unique twist that readers can’t help but share. And when it’s ready, enlist the help of influencers to make your infographic spread like wildfire.
—
This article was updated with support from Graeme Whiles.

